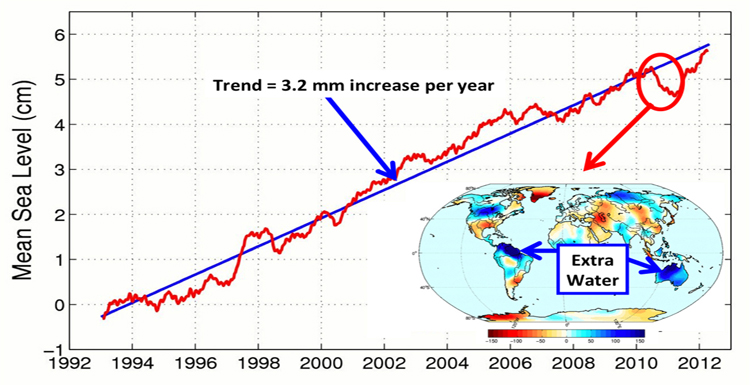
This figure shows changes in global mean sea level as measured by satellite altimetry (NASA/CNES Topex/Poseidon and Jason-1; and NASA/CNES/NOAA/EUMETSAT Jason-2) between 1992 to 2012. The data have been averaged to account for long time scale variations in sea level. The average annual increase in sea level over this timeframe, depicted by the blue line, is 3.2 millimeters per year. The inset shows changes in Earth’s water mass from the beginning of 2010 to mid 2011. Blue colors indicate an increase in water mass over the continents. A new NASA study shows that most of the sea level drop in 2010-11 [red circle] was related to the mass transport of water from the ocean to the continents (primarily Australia, northern South America and Southeast Asia [blue arrows]). While the ocean “lost” water, the continents experienced a gain because of increased rainfalls brought on by the 2010/11 La Nina. By mid-2012, global mean sea level had recovered by more than the 5 millimeters it dropped in 2010/11.
OSTM/Jason 2 is an international endeavor with responsibility for satellite development and launch shared between NASA and CNES. The U.S. National Oceanic and Atmospheric Administration (NOAA) is responsible for satellite operations, and JPL is managing the mission for NASA. Data processing is being carried out by CNES, the European Organisation for the Exploitation of Meteorological Satellites (EUMETSAT) and NOAA.
Image credit: NASA/JPL-Caltech/CNES
 English
  Français
  العربية

