Articles and Interviews

16 January 2013

NASA Finds 2012 Sustained Long-Term Climate Warming Trend

NASA scientists say 2012 was the ninth warmest of any year since 1880, continuing a long-term trend of rising global temperatures. With the exception of 1998, the nine warmest years in the 132-year record all have occurred since 2000, with 2010 and 2005 ranking as the hottest years on record.

NASA’s Goddard Institute for Space Studies (GISS) in New York, which monitors global surface temperatures on an ongoing basis, released an updated analysis Tuesday that compares temperatures around the globe in 2012 to the average global temperature from the mid-20th century. The comparison shows how Earth continues to experience warmer temperatures than several decades ago.

                                     df499f0c123ca16004f34aea7bbffe7a

The average temperature in 2012 was about 58.3 degrees Fahrenheit (14.6 Celsius), which is 1.0 F (0.6 C) warmer than the mid-20th century baseline. The average global temperature has risen about 1.4 degrees F (0.8 C) since 1880, according to the new analysis.

Scientists emphasize that weather patterns always will cause fluctuations in average temperature from year to year, but the continued increase in greenhouse gas levels in Earth’s atmosphere assures a long-term rise in global temperatures. Each successive year will not necessarily be warmer than the year before, but on the current course of greenhouse gas increases, scientists expect each successive decade to be warmer than the previous decade.

“One more year of numbers isn’t in itself significant,” GISS climatologist Gavin Schmidt said. “What matters is this decade is warmer than the last decade, and that decade was warmer than the decade before. The planet is warming. The reason it’s warming is because we are pumping increasing amounts of carbon dioxide into the atmosphere.”

Carbon dioxide is a greenhouse gas that traps heat and largely controls Earth’s climate. It occurs naturally and also is emitted by the burning of fossil fuels for energy. Driven by increasing man-made emissions, the level of carbon dioxide in Earth’s atmosphere has been rising consistently for decades.

The carbon dioxide level in the atmosphere was about 285 parts per million in 1880, the first year in the GISS temperature record. By 1960, the atmospheric carbon dioxide concentration, measured at NOAA’s Mauna Loa Observatory, was about 315 parts per million. Today, that measurement exceeds 390 parts per million.

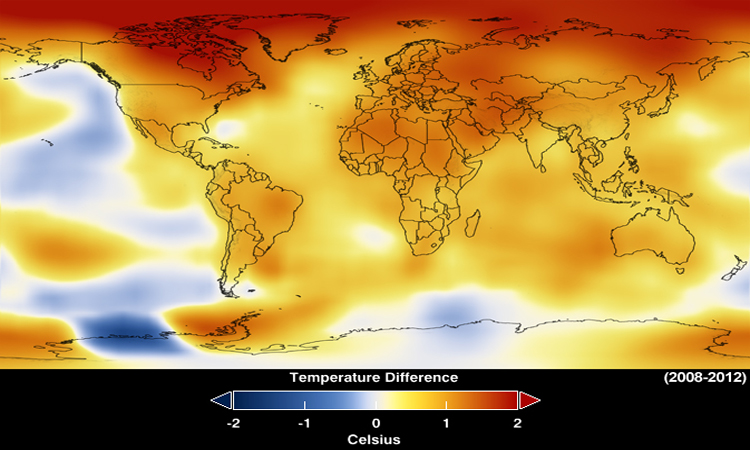
This map represents global temperature anomalies averaged from 2008 through 2012. 
Data source: NASA Goddard Institute for Space Studies
Visualization credit: NASA Goddard’s Scientific Visualization Studio

While the globe experienced relatively warm temperatures in 2012, the continental U.S. endured its warmest year on record by far, according to NOAA, the official keeper of U.S. weather records.

“The U.S. temperatures in the summer of 2012 are an example of a new trend of outlying seasonal extremes that are warmer than the hottest seasonal temperatures of the mid-20th century,” GISS director James E. Hansen said. “The climate dice are now loaded. Some seasons still will be cooler than the long-term average, but the perceptive person should notice that the frequency of unusually warm extremes is increasing. It is the extremes that have the most impact on people and other life on the planet.”

The temperature analysis produced at GISS is compiled from weather data from more than 1,000 meteorological stations around the world, satellite observations of sea-surface temperature, and Antarctic research station measurements. A publicly available computer program is used to calculate the difference between surface temperature in a given month and the average temperature for the same place during 1951 to 1980. This three-decade period functions as a baseline for the analysis. The last year that experienced cooler temperatures than the 1951 to 1980 average was 1976.

The GISS temperature record is one of several global temperature analyses, along with those produced by the Met Office Hadley Centre in the United Kingdom and the National Oceanic and Atmospheric Administration’s National Climatic Data Center in Asheville, N.C. These three primary records use slightly different methods, but overall, their trends show close agreement.


a4

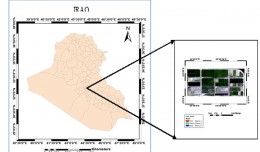
Selecting Suitable Sites for Wind Energy harvesting in Iraq using GIS Techniques

Selecting Suitable Sites for Wind Energy harvesting in Iraq using GIS Techniques  WEDYAN G. NASSIF1,2, DALILA ELHMAIDI1 , YASEEN  K. Al-TIMIMI2  1 Thermal Radiation Research Unit ,Faculty of Sciences of Tunis ,University  o...
by Lamouchi Helmi
0


a3

Machine Learning and Statically for Evaluating the Classification of Medical and Lab Services

Machine Learning and Statically for Evaluating the Classification of Medical and Lab Services Muna R. Harbi1,,Loay E. George2 1.Department of Physics, General Directorate of Thi-Qar Education, Ministry of Education, Thi-Qar, Ir...
by Lamouchi Helmi
0


a2

Study the characteristics and nature of the Indian dates tree. Tamarindus Indica L In the southwestern region (Jizan and Asir)

Study the characteristics and nature of the Indian dates tree. Tamarindus Indica L In the southwestern region (Jizan and Asir) Corresponding Author Mosaed Saeed Ali Alhader King Abdulaziz City for Science and Technology General...
by Lamouchi Helmi
0


AAAA

Geo-spMag Journal Achieves Impact Factor of 1.943 in ISI Indexing Geo-spMag Journal Achieves Impact Factor of 1.943 in ISI Indexing In a significant milestone for Arab scientific publishing, the international peer-reviewed jour...
by Lamouchi Helmi
0


2

Determine the morphostructure phenomenon, East Khor Al-Zubair by Space Imageries

Dr.TorhanAlmofti *                                         Ahmed Ibrahim Saleh Al-Naemi** Abstract Through the use of satellite data taken by the Landsat satellites a color phenomenon was...
by Lamouchi Helmi
0


1

Detection and monitoring crop of wheat and barley by using NDVI stacking technique and spectral angle mapper algorithm

S K AAl-Hummadi[1] N S Nuaimy[2] A L Ubaidy[3] 1Ministry of science and Technology, ,Remote sensing center, Iraq E-mail: shathamaster@yahoo.com   2Ministry of science and Technology, Remote sensing center, Iraq E-mail: ade...
by Lamouchi Helmi
0


2

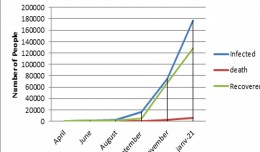
Tunisian economy in the face of the Covid-19 pandemic: State of play, analysis and outlook

Bouzayani Rajab [1]/ Abida Zouheir[2] [1] Bouzayani Rajab : Faculty of Economics and Management of Sfax, University of Sfax – Tunisia. E-mail: bouzayanilazher@gmail.com [2] Abida Zouheir : Faculty of Economics and Mana...
by Lamouchi Helmi
0


Thumbnail.8.640.360

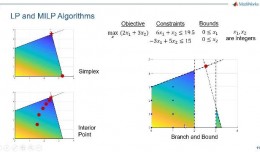
Reducing Total Freshwater Use in the Gold Processing Industry Using Linear Programming

Suliman Emdini Gliwan*1 Kevin Crowe *2 *1Ph.D.Candidate, Faculty of Natural Resource Management, Lakehead University, 955 Oliver Rd, Thunder Bay, ON, Canada (P7B5E1). *2Associate Professor, Faculty of Natural Resource Managemen...
by Lamouchi Helmi
0


06-731x413

Control of a Hybrid Wind-PV and Energy Storage System

Control of a Hybrid Wind-PV and Energy Storage System Mohammed Al Busaidi, Amer Al-Hinai*, Rashid Al-Abri, Mohammed Al-Badi Electrical & Computer Engineering, Sultan Qaboos University, Oman Abstract—Distributed energy gen...
by Lamouchi Helmi
0


images

Modeling Ripeness Grading of Palm Oil Fresh Fruit Bunches through Image Processing using Artificial Neural Network

Modeling Ripeness Grading of Palm Oil Fresh Fruit Bunches through Image Processing using Artificial Neural Network Osama M. Ben Saaed1, Meftah Salem M Alfatni1,2*, Abdul Rashid Mohamed Shariff3 and Hadya S Hawedi1 1Faculty of I...
by Lamouchi Helmi
0


maxresdefault

DETECTIONS OF BUILDINGSDIGITAL SURFACE MODELS DEFORMATIONS GENERATED FROM DRONES NADIR IMAGES

  DETECTIONS OF BUILDINGSDIGITAL SURFACE MODELS DEFORMATIONS GENERATED FROM DRONES NADIR IMAGES Jean A. Doumit*, Souhail F. Awad*,Evgeny N. Kiselev** *Lebanese University, Faculty of Letters and Human Sciences, Department of g...
by Lamouchi Helmi
0


Prezentacja programu PowerPoint

Comparative responses to cadmium toxicity of Arabidopsis thaliana mutant seedling (cad2) and wild type (col0)

Comparative responses to cadmium toxicity of Arabidopsis thaliana mutant seedling (cad2) and wild type (col0) CHAFFEI HAOUARI CHIRAZ1, SLATNI TARAK2, DJEMAL FATMA1, GOUIA HOUDA1 (Company / Faculté des Sciences de Tunis) 1Unive...
by Lamouchi Helmi
0


0 comments »


Be the first to comment!


Leave a Reply

Your email address will not be published. Required fields are marked *

*

* Copy This Password *

* Type Or Paste Password Here *

You may use these HTML tags and attributes: <a href="" title=""> <abbr title=""> <acronym title=""> <b> <blockquote cite=""> <cite> <code> <del datetime=""> <em> <i> <q cite=""> <strike> <strong>